
Analytics
Performance across the book, one client, or one account.
Analytics answers "how is this doing?" at whatever level you point it: the whole book, one client, or one account.
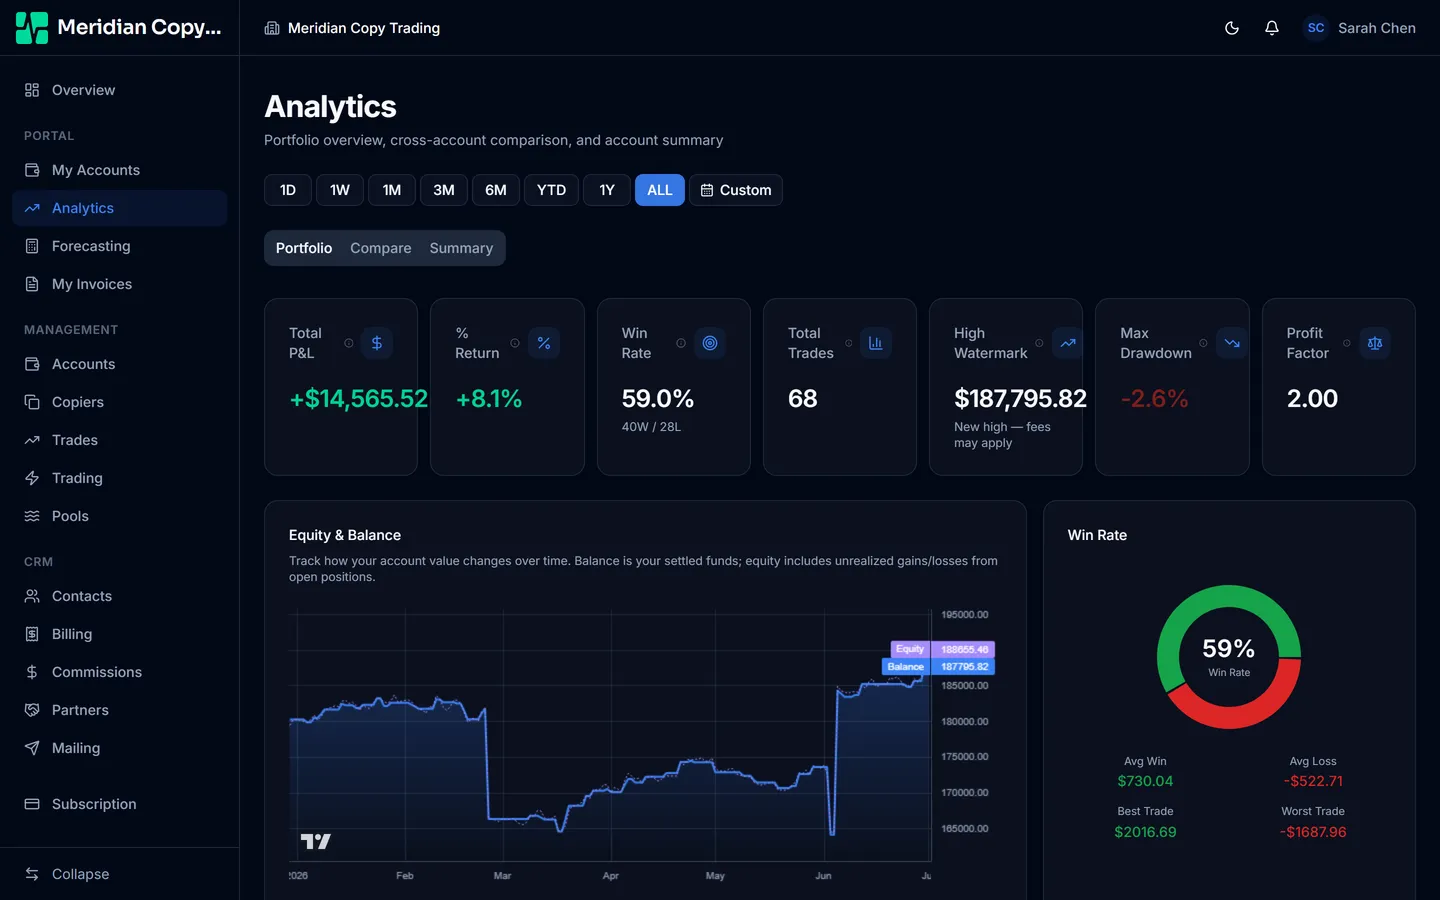
Two controls shape everything on the page
Scope — all accounts, one contact, or one account. Everything below it recomputes. Set it once and it is remembered.
Period — 1D, 1W, 1M, 3M, 6M, YTD, 1Y, ALL, or Custom for a date range. Also remembered, so the page opens where you left it.
If the figures read zero on a book you know is active, check the period before anything else. It defaults to the last month, and a strategy that was quiet through that window genuinely has nothing to show. Click ALL to confirm.
Portfolio
The default tab, and the one to live in.
| Figure | What it is |
|---|---|
| Total P&L | Profit for the period, after commission and swap |
| % Return | That profit as a percentage |
| Win Rate | Winners as a percentage, with the raw W/L counts beside it |
| Total Trades | Trade count for the period |
| High Watermark | The peak the book has reached, flagged when it is at a new high |
| Max Drawdown | The deepest fall from a peak within the period |
| Profit Factor | Gross profit divided by gross loss |
Below them, Equity & Balance plots both lines over time, and a drawdown chart appears when there is any drawdown to show.
Balance and equity are different lines, deliberately. Balance steps on closed trades and cash flows; equity moves continuously with open positions. The gap between them is unrealised P&L, and a persistent gap means positions have been open a long time.
Max drawdown is computed from the combined curve, not by taking the worst number any single account reached. Two accounts each down 10% at different times do not make a 10% portfolio drawdown — the aggregate curve is what actually happened to the book.
Profit factor above 1.0 is profitable. Computed from a handful of trades it means very little; give it a period with real volume.
High Watermark carries a "fees may apply" note when the book is at a new high, because that is exactly the condition under which high-water-mark billing charges. See Billing.
Compare
Several accounts on the same axes. This is how you find the follower that has drifted away from its siblings — usually a risk setting that was changed on one copier and not the others, or a follower that stopped copying weeks ago without anyone noticing.
Summary
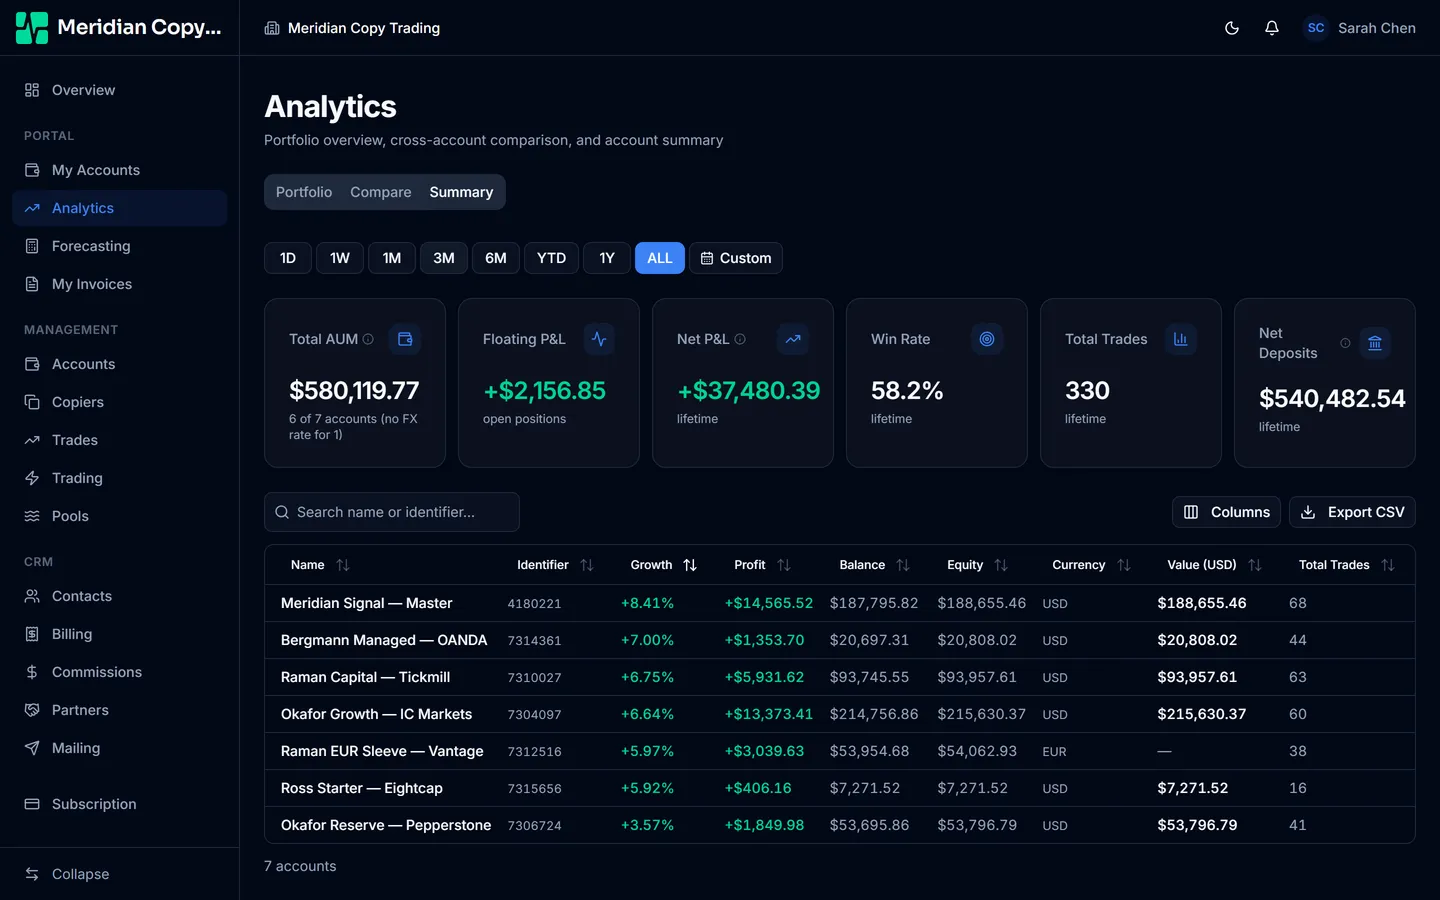
A statement-style view: six aggregate figures across the accounts shown, over a sortable per-account table.
| Figure | What it is |
|---|---|
| Total AUM | Current equity across the accounts shown |
| Floating P&L | Unrealised P&L on open positions |
| Net P&L | Closed-trade profit for the period, after commission and swap |
| Win Rate | Winners as a percentage, for the period |
| Total Trades | Trade count for the period |
| Net Deposits | Deposits minus withdrawals for the period |
Net Deposits sitting beside Net P&L is the point. An account up $40,000 that also took $35,000 in deposits has made $5,000. Either number alone will mislead you; the pair will not.
The table searches by name or account number, sorts on any column, and has an Export CSV button — which is usually the fastest way to get month-end figures to whoever needs them in a spreadsheet.
An Include EA accounts checkbox appears when you have any. EA accounts are often signal sources rather than client money, and folding them into total AUM overstates it.
Accounts in different currencies are converted to your workspace's base currency before they are summed, so the total is a real total rather than a mixture. The base currency is your workspace's billing currency — USD unless it was changed when the workspace was created — and it is named beside the account count.
An account whose currency has no available rate is marked unconverted rather than folded in at the wrong value.
When the figures look wrong
After the period, two causes are worth checking:
- The account is disconnected. Its equity is the last value Trademetry saw, not a live one. Check account status.
- A cash flow was missed. Deposits and withdrawals are imported automatically, but the account's Deposits / Withdrawals tab is where you confirm a transfer was captured — a missing one shows up as profit.
Figures the server computes as "today" use the server clock. When you are reconciling against a broker statement, compare on a closed day rather than the current one.